Insights / Software Intensive Networks
Building a 360° Network Cockpit
Implement an intelligent network visualization solution powered by Graph technology to deliver network insights faster.
Owing to rapid network expansion, major service providers in the connectedness industry are facing a critical challenge with the rise of data silos in their ecosystem. As a result, network data is dispersed across a variety of siloed and disjointed systems. This makes deriving insights from data collected across diverse assets more difficult. Several disconnected systems that consist of untraceable integrations and interfaces must be integrated to get a comprehensive view of the massive dataset. As a result, the service providers face inefficient network and resource utilization, delays in rolling out new network designs, and ineffective network troubleshooting.
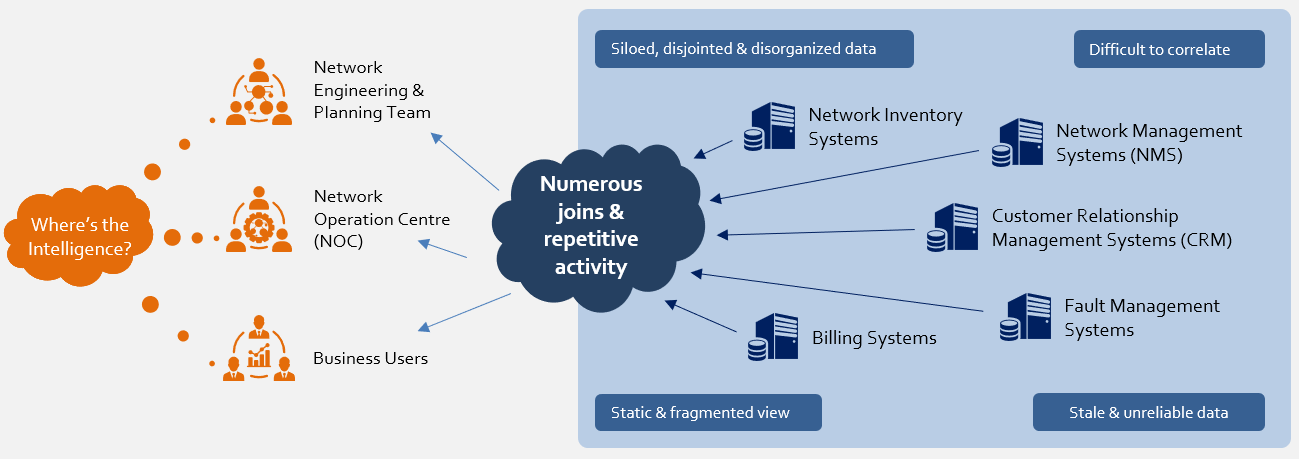
There is a necessity for service providers in the connectedness industry to build a real-time 360° Network Visualization to drive smart decision making. Most service providers have started to implement Graph databases to address the problem of data silos and information irregularities in Network management. To be effective, service providers must develop both upstream and downstream data ingestion strategies. In this insight, we explore these two key components in-depth and identify the key capabilities required to build them effectively. Incorporating the 360° real-time network visualization approach can create a convergent and intelligent view of the network. In the Connectedness market, it helps to meet the growing demands of Network Planning, Network Operations (NOCs), and various user communities.
Eliminate data silos and irregularity challenges in Network management and accelerate design rollout by 33%.